Monday, 13 March 2017

A few notes on Dave Thomas' "Agile is Dead" talk


The talk:  Agile is Dead

A forty minute talk compressed for quick reading.


  • The title is designed to be provocative.  The actual message is a simple grip at the industries trend of turning an adjective into a noun.  Which was done partly to sell you something, training, consulting, books, conferences, ..
  • Dave Thomas was part of the original meetup that produced the agile manifesto.
  • The talk is mostly a rallying call to remember that the original agile manifesto was focused on principles/values and not techniques.  It was called the 'Manifesto for Agile Software Development' and not the agile manifesto for a reason.
  • He points out that every rule/recommendation/advice will fail in some circumstances.  Thus beware of anybody who says 'always do X'.
  • The core technique within agile is simply the 'do/measure/adapt' cycle, with one caveat that is sometimes forgotten.  When two or more options exist that appear equal, choose the one that is more open to change.


Sunday, 25 May 2014

Alternative Log Level Structure


Over the years I have become increasingly dissatisfied with the standard log levels used in Java.  The main problem being that I find with them is that they can be unclear as to where a specific log message belongs: trace, debug, info, warn, error, fatal.

At first glance it appears very straight forward, however after working with many talented teams of developers I have observed that the log levels take effort to standardise across the team and that each team has had their own subtly different guidelines.   Essentially it takes effort to disambiguate edge cases; is a message info or warn? trace or debug? warn or error?  It becomes grey because the level changes based on who the audience is for the message, and typically developers will answer that question from their own view point. 

Previously I posted some guidelines on how we used those log levels; a few years on, I am both older and have less hair.  I have just found it easier to rename each of the log levels and be done with it.  Previously the desire to be a good log4j citizen stopped me, however being somewhat older I am less tolerant of conventions that cause me to loose my hair.  I just don’t have much hair left, and so I need to be more protective of it.   ;)


Here are the log levels that I currently use, I find them to be much more intuitive.

Audit (record of what happened, useful when investigating what the system did and why)

    dev   - diagnostic information useful for developers 
    ops   - diagnostic information useful for people who maintain the system 
    user  - diagnostic information about a user, and if ever seen by a savvy user would be meaningful to them  e.g. ‘CK created account’, and ‘CK logged in'

Alerts (requires action)

    warn - a problem has been detected and mitigated or a potential problem has been detected that does not yet affect users; (action: notify ops/review during office hours to help pre-empt fires/raise awareness of what the state of the system is)
    fatal  - the preverbal has hit the fan, progress can not be made by users (action: wake everybody up)


Alerts are special in two ways, firstly they are raising awareness of an ongoing problem that has a start and hopefully (eventually) an end.  Thus they need to make it clear that yes, we still have a problem or yay the problem has ended.  Secondly, they are a call to action.  Somebody needs to pay attention to alerts, either just by being aware that the system is at reduced capacity (warn) or get out of bed and sound the alarms, round up the troops etc;  the entire system is down (fatal).

Clearly we do not want many alerts.  If there are too many red herrings then people will ignore them, thus the alerts need to be very clear, complete and as rare and accurate as possible.   Thus most messages will be informative/audits and not alerts at all, in which case it must be very clear who the target audience is.  If that audience turn around and say, I do not understand or care then the message comes out entirely.   


I have found that agreeing in a team of developers who a message is for, and whether they need to take action or not to have a lot less grey areas than agreeing what the severity of that message is in relation to another message.  The relative comparison becomes a lot less important.  Thus once a scheme like this is in place, enforcing the rules becomes a lot easier.  The usage is intuitive, so there is little need to keep reminding people (myself included).   


Saturday, 10 May 2014

Which is faster in Java, Reflection or MethodHandle?


2014 has been shaping up to be an awesome year so far.  London is a great place to work, especially when it has given me a lot of opportunities to figure out how to make Java run faster.  

For Reflection vs MethodHandles, lets jump straight to some numbers.  The code used to create these benchmark numbers is included at the end.


Direct Method Call0.1ns
Reflection4ns
MethodHandle0.1ns - 110ns
Measurements taken running Java 7 on a shiny OSX laptop


Huh?  Why the huge range of values for MethodHandle?  The reason is that it depends on how the MethodHandle is created and used.  Being a richer API than reflection, it can either run like a farm pig ready for Christmas or become optimised down to being the same as a direct method call.  Awesome.  Thus this post shows how to avoid the costs, and stream line the use of MethodHandle.


Unreflect87ns
Lookup then bind105ns
Unreflect then bind 111ns
Invoke exact 11ns
Unreflect invokeExact 6ns
Store MethodHandle in private static final field 0.1ns
Method in private static final field 4ns

These numbers show that some care needs to be taken with MethodHandle, but treat it well and store it in a private static final field and then Hotspot can optimise the reflection out entirely.   Pretty awesome. 


package reports.signals;

import com.softwaremosaic.junit.JUnitMosaicRunner;
import com.softwaremosaic.junit.annotations.Benchmark;
import org.junit.runner.RunWith;

import java.lang.invoke.MethodHandle;
import java.lang.invoke.MethodHandles;
import java.lang.invoke.MethodType;
import java.lang.reflect.InvocationTargetException;
import java.lang.reflect.Method;


/**
 *
 */
@RunWith(JUnitMosaicRunner.class)
public class SignalManagerExperimentalTest {

    private int i=0;

    public void m() {
        i += 1;
    }

    private static final int NUMITS = 10000;

/*
    6.61ns per call
    4.95ns per call
    4.08ns per call
    3.95ns per call
    3.93ns per call
    3.88ns per call
     */
    @Benchmark( value=1000, durationResultMultiplier = 1.0/NUMITS )
    public int fooRef() throws NoSuchMethodException, InvocationTargetException, IllegalAccessException {
        Method f = this.getClass().getMethod( "m" );

        for ( int i=0;i
            f.invoke( this );
        }

        return i;
    }

    private static final Method pf = getF();

    private static Method getF() {
        try {
            return SignalManagerExperimentalTest.class.getMethod( "m" );
        } catch ( NoSuchMethodException e ) {
            e.printStackTrace();
        }

        return null;
    }

/*
    7.27ns per call
    4.75ns per call
    3.79ns per call
    3.72ns per call
    3.71ns per call
    4.29ns per call
     */
    @Benchmark( value=1000, durationResultMultiplier = 1.0/NUMITS )
    public int fooRefPF() throws NoSuchMethodException, InvocationTargetException, IllegalAccessException {
        for ( int i=0;i
            pf.invoke( this );
        }

        return i;
    }

/*
    0.09ns per call
    0.12ns per call
    0.10ns per call
    0.11ns per call
    0.10ns per call
    0.10ns per call
     */
    @Benchmark( value=1000, durationResultMultiplier = 1.0/NUMITS )
    public int fooDirect() throws NoSuchMethodException, InvocationTargetException, IllegalAccessException {
        for ( int i=0;i
            m();
        }

        return i;
    }

/*
unreflect
    87.07ns per call
    87.38ns per call
    87.39ns per call
    87.98ns per call
    86.89ns per call
    88.20ns per call
*/
@Benchmark( value=1000, durationResultMultiplier = 1.0/NUMITS )
public int unreflect() throws Throwable {
    Method f = this.getClass().getMethod( "m" );
    MethodHandle h = MethodHandles.lookup().unreflect( f );

    for ( int i=0;i
        h.invoke(this);
    }

    return i;
}

/*
lookup then bind
    110.45ns per call
    106.48ns per call
    106.04ns per call
    106.15ns per call
    105.20ns per call
    105.13ns per call
*/
@Benchmark( value=1000, durationResultMultiplier = 1.0/NUMITS )
public int lookupBind() throws Throwable {
    MethodHandle h = MethodHandles.lookup().bind( this, "m", MethodType.methodType(Void.TYPE) );

    for ( int i=0;i
        h.invoke();
    }

    return i;
}
/*
unreflect then bind
    112.95ns per call
    110.62ns per call
    112.70ns per call
    112.77ns per call
    111.10ns per call
    111.64ns per call
*/
@Benchmark( value=1000, durationResultMultiplier = 1.0/NUMITS )
public int unreflectBind() throws Throwable {
    Method f = this.getClass().getMethod( "m" );
    MethodHandle h = MethodHandles.lookup().unreflect( f ).bindTo( this );

    for ( int i=0;i
        h.invoke();
    }

    return i;
}

    /*
    invoke exact
        12.65ns per call
        12.03ns per call
        11.17ns per call
        10.46ns per call
        10.36ns per call
        10.18ns per call
*/
    @Benchmark( value=1000, durationResultMultiplier = 1.0/NUMITS )
    public int invokeExact() throws Throwable {
        MethodHandle h = MethodHandles.lookup().bind( this, "m", MethodType.methodType(Void.TYPE) );

        for ( int i=0;i
            h.invokeExact();
        }

        return i;
    }

    /*
        unreflect invokeExact
            7.49ns per call
            7.12ns per call
            6.75ns per call
            6.72ns per call
            6.22ns per call
            5.92ns per call
             */
    @Benchmark( value=1000, durationResultMultiplier = 1.0/NUMITS )
    public int unreflectInvokeExact() throws Throwable {
        Method f = this.getClass().getMethod( "m" );
        MethodHandle h = MethodHandles.lookup().unreflect( f );

        for ( int i=0;i
            h.invokeExact(this);
        }

        return i;
    }


    private static final MethodHandle mh = lookupViaFindVirtual();

    private static MethodHandle lookupViaFindVirtual() {
        try {
            return MethodHandles.lookup().findVirtual( SignalManagerExperimentalTest.class, "m" , MethodType.methodType(Void.TYPE));
        } catch ( Throwable e ) {
            e.printStackTrace();

            return null;
        }
    }


/*
    0.12ns per call
    0.09ns per call
    0.12ns per call
    0.11ns per call
    0.10ns per call
    0.10ns per call
     */
    @Benchmark( value=1000, durationResultMultiplier = 1.0/NUMITS )
    public int fooHandleSF() throws Throwable {

        for ( int i=0;i
            mh.invokeExact( this );
        }

        return i;
    }
}


Sunday, 2 March 2014

Java 9 Wish List

With the release of Java 8 close, it is time for me to update my Java wish list for Java.   (http://chriskirk.blogspot.com/2011/06/java-8-wishlist.html)


1. Support memory mapping of files greater than 2GB.  Memory mapping files is the fastest way to work with files in Java, and it is a technique that I am using more and more as I push for faster systems.  Having to work around the 2GB limit is tedious and unnecessary.

2. Big heap support.  Java Garbage Collectors are for the most part still stop the world collectors, which get slower as the heap size/live object count increases.  As memory is becoming so cheap, it is a shame to have to go off heap in order to maintain server performance.

3. Efficiently support primitives with Generics and polymorphic method dispatches.  It is a pain in the backside to have to duplicate methods just to support the different primitives efficiently.

4. Continuations is becoming increasingly mainstream now, and having clean ways to incrementally process large data sets asynchronously is very valuable.  It could be as simple as the Python 'yield' keyword, but ideally I want to be able to make synchronous code such as a db call not hold on to a thread, and yet be as maintainable as a normal synchronous call.

5.  File I/O still blocks.  That is why memory mapping is so valuable in Java as it does not block.  Please add true asynchronous file support.  The Async file I/O added to NIO is still implemented under the hood using the same blocking APIs, making it even slower than the synchronous apis. Shame on you Sun!  (may your rest in peace; and shame on Oracle for leaving it alone for so long).

6. Unsigned versions of short, int and long.  Java may not be C, but unsigned types are useful when working with positive numbers.

7.  Packed object arrays.  Currently Java arrays of objects are arrays of references, references have a cost to follow that is greater than many would assume (due to the way modern CPUs and cacheing subsystems work).  Thus support for arrays of structures, more like C would allow for more efficient Java code to be written.

8. Access to method parameter names at runtime.

9. Access to java docs at runtime.

10. Faster compiler.

11. Default parameter values.

12. Language support for reflection.

13. Drop the annoying diamond operator (<>).

14. Multi line string support.

15. Mix-in support.


What is on your wish lists?  Please share.

Wednesday, 4 September 2013

What is a Java Safepoint?

This is the best description of the behaviours of a safepoint in Java  that I have come across, it was written by Gil Tene; CTO of Azul and posted to the mechanical sympathy mailing list run by Martin Thompson.  I capture it here for my own reference.

1. A thread can be at a safepoint or not be at a safepoint. When at a safepoint, the thread's representation of it's Java machine state is well described, and can be safely manipulated and observed by other threads in the JVM. When not at a safepoint, the thread's representation of the java machine state will NOT be manipulated by other threads in the JVM. [Note that other threads do not manipulate a thread's actual logical machine state, just it's representation of that state. A simple example of changing the representation of machine state is changing the virtual addresss that a java reference stack variable points to as a result of relocating that object. The logical state of the reference variable is not affected by this change, as the reference still refers to the same object, and two references variable referring to the same object will still be logically equal to each other even if they temporarily point to different virtual addresses].

2. "Being at a safepoint" does not mean "being blocked" (e.g. JNI code runs at a safepoint), but "being blocked" always happens at a safepoint.

3. The JVM may choose to reach a global safepoint (aka Stop-The-World), where all threads are at a safepoint and can't leave the safe point until the JVM decides to let it do so. This is useful for doing all sorts of work (like certain GC operations, deoptimization during class loading, etc.) that require ALL threads to be at a well described state.

4. Some JVMs can bring individual threads to safepoint without requiring a global safepoint. E.g. Zing uses the term Checkpoint (first published in [1]) to describe a JVM mechanism that individually passes threads through thread-specidfic safepoints to perform certain very short operations on individual thread state without requiring a Stop-The-Wolrd pause.

5. When you write Unsafe java code, you must assume that a safepoint MAY occur between any two bytecodes. 

6. Unsafe calls are not required to have safepoints within them (and many/most don't), but they MAY include one or more safepoints. E.g. an unsafe memoryCopy MAY include a periodic safepoint opportunities (e.g. take a safepoint every 16KB). Zing sure does, as we do a lot of under the hood work to keep TTSP in check.

7. All [practical] JVMs apply some highly efficient mechanism for frequently crossing safepoint opportunities, where the thread does not actually enter a safepoint unless someone else indicates the need to do so. E.g. most call sites and loop backedges in generated code will include some sort of safepoint polling sequence that amounts to "do I need to go to a safepoint now?". Many HotSpot variants (OpenJDK and Oracle JDK) currently use a simple global "go to safepoint" indicator in the form of a page that is protected when a safepoint is needed, and unprotected otherwise. The safepoint polling for this mechanism amounts to a load from a fixed address in that page. If the load traps with a SEGV, the thread knows it needs to go to enter a safepoint. Zing uses a different, per-thread go-to-safepoint indicator of similar efficiency.

8. All JNI code executes at a safepoint. No Java machine state of the executing thread can be changed or observed by it's JNI code while at a safepoint. Any manipulation or observation of Java state done by JNI code is achieved via JNI API calls that leave the safepoint for the duration of the API call, and then enter a safepoint again before returning to the calling JNI code. This "crossing of the JNI line" is where most of the JNI call and API overhead lies, but it's fairly quick (entering and leaving safepoint normally amounts to some CAS operations).

Friday, 21 June 2013

How to install Siege for Mac OS X 10.8


Siege is a wonderful tool for benchmarking http urls.  Unfortunately since Mountain Lion it can be a bit fidly to install, the main download website has a dmg file that once downloaded says that ones version of OSX is not supported; so build from source.  And building from source has problems with X not being supplied by default.

Brew FTW.

So I resorted to bundled packagers, firstly fink but then Brew.  Brew worked first time with little effort.

http://mxcl.github.io/homebrew/


    ruby -e "$(curl -fsSL https://raw.github.com/mxcl/homebrew/go)"
    brew doctor

    brew install siege
    siege.config

Then edit the .siegerc file generated by siege.config, setting connection from 'close' to 'keep-alive'.  I also disable logging too.


Benchmarks can then be run as follows:

    siege -c 100 -b http://www.google.com > /dev/null

Press ctrl-c when you want to stop the test and see the stats.


Sunday, 2 June 2013

Vagrant Script for compiling JDK 8 from source

I recently wanted to take a look at Java 8, without wanting to pollute my working environment. The JDK has a fair few dependencies that must be installed before it can be compiled. So I created the following Vagrantfile which I have chosen to share here.

Vagrant is a great wrapper for running virtual machines locally. After installing vagrant, to just type 'vagrant up' in the same directory as the following file and it will handle creating a 64bit Ubuntu VM locally, installing dependencies, checking out the head branch of JDK8 and compiling it.

After Vagrant has finished creating the VM, and compiling the JDK.  You can log in to the Ubuntu instance by typing 'vagrant ssh' and from there you will be able to use the compiled JDK, make changes, recompile and so forth.


# -*- mode: ruby -*-
# vi: set ft=ruby :

$checkoutAndCompileJDK = <<SCRIPT
  sudo vagrant
  cd ~

  sudo apt-get update

  sudo apt-get install -y mercurial
  sudo apt-get install -y make
  sudo apt-get install -y unzip
  sudo apt-get install -y zip
  sudo apt-get install -y openjdk-7-jdk
  sudo apt-get install -y build-essential
  sudo apt-get install -y libX11-dev libxext-dev libxrender-dev libxtst-dev
  sudo apt-get install -y libcups2-dev
  sudo apt-get install -y libfreetype6-dev
  sudo apt-get install -y libasound2-dev
  sudo apt-get install -y ccache

  sudo apt-get install -y alsa
  sudo apt-get install -y cups
  sudo apt-get install -y xrender

  sudo apt-get install -y libpng12-dev
  sudo apt-get install -y libgif-dev
  sudo apt-get install -y libfreetype6
  sudo apt-get install -y pkg-config


  hg clone http://hg.openjdk.java.net/jdk8/jdk8 jdk8

  cd jdk8

  bash ./get_source.sh

  bash ./configure
  make all
SCRIPT


Vagrant.configure("2") do |config|
  config.vm.box = "precise64"

  config.vm.box_url = "http://files.vagrantup.com/precise64.box"

  config.vm.provision :shell, :inline => $checkoutAndCompileJDK

  config.vm.provider :virtualbox do |vb|
    vb.customize ["modifyvm", :id, "--memory", "4096"]
  end

end

Friday, 17 May 2013

Modern CPU design: How fast is a single CPU core?


Up until 2003 CPUs clock rates were increasing rapidly, however since 2003 clock rates have maxed out at around 3GHz.  This maxing out has happened because as electrical components have become smaller, unwanted effects occur such as current leakage. Eventually as the components get so small, the leakage can become so bad that more current goes in than useful work can occur. It over heats and becomes very unstable.  There is some good news here though, the clock rate of CPUs may have plateaued for now but that does not mean that CPUs stopped getting faster.

GHz relates to CPU speed in much the same way as horse power relates to the speed of cars.  That is, it does and it does not.  There are ways to make a car go faster without increasing the horse power of the engine.  And that is also true with CPUs.

So how do modern CPUs keep getting faster?  A combination of being more efficient, and more parallel.  By more parallel I do not just mean that more CPUs are appearing in modern computers; which is actually true in its own right but it is not the full story.  I also mean that a single CPU is also becoming more parallel in itself than ever before.

As an example of this, try running the following Java code.  This code iterates over an array of bytes, and assigns the value 42 to each element.  Over and over again.


public class ByteArrayWrite {

    public static void main( String[] args ) {
        ByteArrayWrite b = new ByteArrayWrite();

        System.gc();

        b.run();
        b.run();
        b.run();
        b.run();
        b.run();
        b.run();


        b.tearDown();
    }

    private int arraySize;
    private byte[] array;

    public ByteArrayWrite() {
        this.arraySize = 100000;

        array = new byte[arraySize];
    }


    public void tearDown() {
        for ( int j=0; j<arraySize; j++ ) {
            if ( array[j] != 42 ) {
                throw new IllegalStateException( "array writes were optimised out, invalidating the test" );
            }
        }

        array = null;
    }

    protected void run() {
        long startNanos = System.nanoTime();
        int numItterations = 100000;
        for ( int i=0; i<100000; i++ ) {
            for ( int j=0; j<arraySize; j++ ) {
                array[j] = 42;
            }
        }

        long   numOps         = ((long) numItterations) * arraySize;
        long   durationNanos  = System.nanoTime() - startNanos;
        double durationMillis = durationNanos / 1000000.0;
        double rateNS         = ((double)numOps) / durationNanos;

        System.out.println( String.format("%.2f array writes/ns  [totalTestRun=%.3fms]", rateNS, durationMillis) );
    }

}

At 3GHz a single CPU can perform approximately 3 operations per nanosecond (assuming one instruction per clock cycle).  Running the code above on my 2.7GHz laptop printed out on average 35 array writes per nanosecond.  That is a lot more than the 3 CPU instructions per ns that one would have expected given the clock rate.  How is this possible?


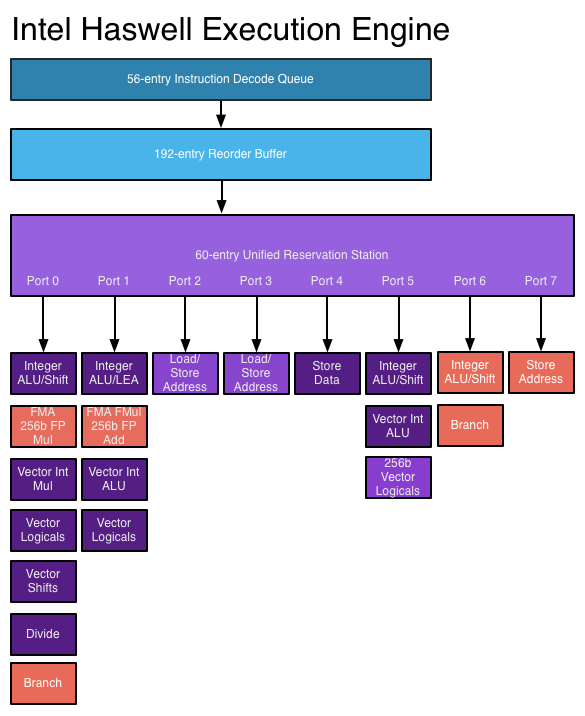
The following diagram describes a single core from the latest Intel Haswell CPU.


This diagram is interesting because it shows that a single Haswell CPU has 7 ports. Each port is capable of parallel execution of CPU instructions.  Each of the ports has one or more execution units underneath it; 20 in total.  On top of this, the instruction decoding and scheduling to ports happens in parallel with multiple decoders.  Thus if given the opportunity a single 3GHz CPU can perform tens of instructions per clock cycle or more.  Which explains why the Java code above beat the expected 3 ops per ns expectation.  Now not all execution units are created equal, they are specialised to different tasks which is part of the reason why there is a scheduler assigning work to each of the ports.  However the point stands. As programmers we think of code running on a single CPU as a linear sequence of steps, each one happening after the other.

Modern CPUs like the x86 offer the potential for incredible amounts of parallelism.  With each new release of a CPU, we are seeing more CPU ports. Wider vector instructions. More execution units. More decoders. Wider data paths. In short, more and more parallelism within a single CPU.   This parallelism is typically handled for us by the awesome work carried out by the hardware engineers.  Thus our single threaded applications get executed faster without any extra work on our part.  This makes coding for them very simple, while still getting many of the benefits parallelism.


Friday, 10 May 2013

Notes on Java 8's removal of PermSpace

The details were posted to the openjdk mailing list below. The short version is that PermSpace is being renamed ;)

http://mail.openjdk.java.net/pipermail/hotspot-dev/2012-September/006679.html

  • Java 7: Interned strings moved to Heap
  • Java8: Moves Permspace from heap to a native memory region called 'Metaspace' and changes it to automatically grow in size by default
This means that the out of permspace error will be less common (more memory available to consume as the space grows in size), but leaks may be harder to track down as diagnostic leaks on that information will be less useful (stack tools will no longer be usable). To regain the errors to detect the leaks earlier, MaxMetaspaceSize will be supported.

Sunday, 14 April 2013

How can JVM jitter get caused by a for loop with no object allocations?

It is not uncommon for Java programs to pause for periods of time, sometimes long periods. Garbage Collection is usually the culprit and there is a lot of documentation on its effects. However it is not the only cause, and while benchmarking I/O performance on Java I hit an unusual case where summing up the contents of an array of bytes caused every other Java thread to block for 2.5 seconds while not blocking or slowing down itself. Very curious, and it highlights that the side effects between Java threads can be very subtle and non-obvious. For this blog post I have documented how I performed the test, and how I tracked down the offender. Along the way I cover some aspects of how Hotspot works its magic, including compilation of Java code and when it will halt the execution of all Java threads.

The Problem

Here is the offending code, it consists of two loops that together sum up the contents of an array of bytes 'n' times. No obvious causes for blocking other JVM threads here. It does not synchronise, or use volatile, CAS, wait, or notify. In fact the data structures are all created on one thread and accessed from that one thread without sharing it.

 
public long invoke( int targetCount ) {
    long sum = 0;
    for ( int i=0; i<targetCount; i++ ) {
        for ( int j=0; j<arraySize; j++ ) {
            sum += array[j];
        }
    }

    return sum;
}
This code runs on my laptop in 2.4 seconds, averaging 2.5 array reads and summations every nanosecond. This benchmark did not become interesting until I decided to also measure the JVM jitter. My end goal was to benchmark disk IO, and JVM jitter is a way to see the side effects of overloading the IO system and kernel (say by memory mapping too much data); however it showed something very interesting in the totally in-memory case that I had not expected. The jitter thread got blocked for 2.5s, it was a one off block that did not repeat in the same run; but it did occur at the same point of every run. Why would a for loop cause other threads to block? EVER?

Measuring JVM Jitter

Perhaps the problem was with how I measured the jitter. To measure I started a background daemon thread that repeatedly sleeps for 1ms and then measures how long after the 1ms period it took for it to actually wake up. It then stores the max length of blocked time and repeats. Java is well known for having limitations in its reading of time, and most thread schedulers are optimised for speed over accuracy thus it is expected that the thread will pretty much always wake up some time after the 1ms period. The question is, how long after. I hope that you agree that this code works well and does what it says on the tin.

public class MeasureJitter extends Thread {
    private AtomicLong maxJitterWitnessedNS = new AtomicLong(0);

    public MeasureJitter() {
        setDaemon( true );
    }

    public void reset() {
        maxJitterWitnessedNS.set( 0 );
    }

    public double getMaxJitterMillis() {
        return maxJitterWitnessedNS.get()/1000000.0;
    }

    public void printMaxJitterMillis() {
        System.out.println( "getMaxJitterMillis() = " + getMaxJitterMillis() );
    }

    @Override
    public void run() {
        super.run();

        long preSleepNS = System.nanoTime();
        while( true ) {
            try {
                Thread.sleep( 1 );
            } catch (InterruptedException e) {
                e.printStackTrace();
            }

            long wakeupNS = System.nanoTime();
            long jitterNS = Math.max(0, wakeupNS - (preSleepNS+1000000));

            long max = Math.max( maxJitterWitnessedNS.get(), jitterNS );
            maxJitterWitnessedNS.lazySet( max );

            preSleepNS = wakeupNS;
        }
    }
}
It turns out that on my system the normal latency was 0.4ms, however it always jumped to 2.5s at the same point of the test run. Every time. That is a jump from 0.4ms to 2500ms, a huge jump. When benchmarking Java, one always skips the first values as they are quite erratic and slow. However this peaked my interest because while the background jitter measuring thread was delayed by 2.5 seconds the throughput of the array counting was not slowed at all. So the question was, why? And inorder to understand it, I had to peel back the layers of the JVM.

Java and Stop the World events

There are times when Java has to halt all threads. The most famous of these is Garbage Collection. A recorded statistic for Java is an average of 1 second of halting all Java threads per 1-2Gb of heap space; this statistic is obviously highly variable. In this case, the heap space was 500Mb, there were no objects being allocated and the main work thread was not stopped. It was the background daemon thread that was getting the Jitter. So this did not sound like GC, but just to be sure I added -XX:+PrintGCDetails to the JVM start up command and confirmed that there was indeed no GC going on. My next suspicion was that it was the Daemon thread that was not getting scheduled for some reason. However the Unix thread schedulers are very efficient, and while it may assign the jitter thread to the same cpu core that was doing the work that would not block it from being run for two and a half seconds. I would have expected either 1) another core to have stolen the work before 2.5 seconds was up or 2) for the busy core to have been paused and the other thread run (this is called preemption). In either case the result should have been variable. With variations in the jitter time, and in the case of stealing time from the worker thread, slowing the worker thread down. None of this was the case, so my suspicion fail upon Hotspot itself. Was Hotspot blocking other threads as a side effect of generating native assembler code?
Alexey Ragozin reports that the Oracle Hotspot implementation will perform a request to stop all threads when:
  • Garbage collection pauses (depends on the GC algorithm being used)
  • Code deoptimization (in response to new information from newly loaded classes, null pointer exceptions, division by zero traps and so forth)
  • Flushing code cache
  • Class redefinition (e.g. hot swap or instrumentation)
  • Biased lock revocation (and as we learned in this post, turning the BiasedLock mechanism on)
  • Various debug operation (e.g. deadlock check or stacktrace dump)

Hotspot Compilation on modern JVMs

The latest Oracle VMs use tiered compilation. That is they start executing Java Byte Codes via an interpretor. Which is a flash back in time to Java's origins, back before the days of JIT and Hotspot; to a time when Java had a deserved reputation for being very slow. Very very slow ;) The VM still executes code via the interpretor so that it can startup faster, and to gather some statistics to inform what it should compile/optimise and how. Every method call has with it a counter, as does the back edge of every for loop that has not been unrolled (including nested for loops). When the sum of these two counters exceeds a threshold, then Hotspot will schedule a request to compile the method. By default this compilation happens in the background, and it then replaces the interpreted version of the method when it is next called.
For methods that take a very long time to complete, or perhaps never complete because they stay within a loop then the JVM is capable of optimising the method from a safe point in the loop. It can then swap in the new implementation when the method is at that same point. HotSpot calls this 'On Stack Replacement' or OSR for short. Now my assumption has always been that this hot replacement would only slow down the thread that was executing the code, and in most cases not even that thread should ever suffer.
Hotspot's compilation can be monitored by adding the following JVM flag: '-XX:+PrintCompilation'
This flag resulted in the following output:
2632   2%      com.mosaic.benchmark.datastructures.array.UncontendedByteArrayReadBM::invoke @ 14 (65 bytes)
6709   2%     made not entrant  com.mosaic.benchmark.datastructures.array.UncontendedByteArrayReadBM::invoke @ -2 (65 bytes)
The format for this output is documented here. In short it says that the method that held the for loops above was compiled to native code, swapped in to the running method via OSR and then 4.1 seconds later the optimised version of the code was flagged sub optimal and to be replaced (made not entrant). Was this the cause? According to the documentation of this output, marking the method none entrant does not prevent the method that is currently running. At some point the JVM should swap the method over to a newly compiled version and mark the old version as a zombie, ready to be cleaned out. Marking it non-entrant is designed to stop any new methods from running that version of the code. Could this be blocking other threads? I'd hope not as events that invalidate optimised code is fairly common in Java. Java is cited as having cases where it can run faster than statically compiled C code. This happens because Java can look at how it is really being used at run time and re-optimise the code on the fly. Causing big latencies here would kill that selling point of Java. So the question is, how do we get a smoking gun that proves that this is the problem?


Debugging Hotspot Safe Points

The JVM cannot just stop all threads. When the JVM wants to perform an exclusive change it has to register its desire to stop all threads and then it has to wait for the threads to stop. Threads only check the need to pause at 'safe points', which have been nicely documented by Alexey Ragozin in his blog post titled Safepoints in HotSpot JVM. The safepoints are on JNI boundaries (enter or exit), or calling a Java method.
To see when Java is halting the world, add the following flag to the command line: '-XX:+PrintGCApplicationStoppedTime'. Despite its misleading name, this option prints out the time that the JVM sits waiting for all threads to stop. It is not just about GC time.
For me, this flag resulted in the following smoking gun.

Total time for which application threads were stopped: 2.5880809 seconds
The pause event was identical to the jitter being reported. To understand this further the following two JVM flags have to be used: ' -XX:+PrintSafepointStatistics -XX:PrintSafepointStatisticsCount=1'.
         vmop                    [threads: total initially_running wait_to_block]    [time: spin block sync cleanup vmop] page_trap_count
4.144: EnableBiasedLocking              [      10          1              1    ]      [  2678     0  2678     0     0    ]  0   
Total time for which application threads were stopped: 2.6788891 seconds
This output tells us that the JVM waited 2.678 seconds to stop the world and that the reason for wanting to stop the world was to enable biased locking. Biased locking, as it turns out is an optimisation for lock acquisitions which are usually only locked by the same thread (but could be locked by other threads). It reduces the cost of the same thread re-acquiring the same lock at the expense of increasing the cost for any other thread that wants to acquire it. This then is our smoking gun.

It turns out that during start up of the JVM, Oracle keep biased locking disabled for the first four seconds. This is because there is a lot of contention within the JVM during this startup window and thus they delay turning it on and turning it on is a Stop the World event.  The stop the world event then had to wait for a safe point to be reached, and it so happens that the thread running had no safe point within its for loop which took a little while to run to completion.

Conclusions

JVM jitter occurs anytime that the JVM wants to stop all threads so that it can gain exclusive access to its internal data structures. How long this jitter lasts depends on how long it takes to stop all of the threads, and this in turn depends on when the threads will reach the next safe point. Calling native methods that take a long time to finish, or using long loops that do not call out to any other method can result in very long delays. We saw a 2.5s delay here due to a for loop iterating over an array of bytes. Admit-ably this is a contrived micro benchmark, however Gil Tene CTO from Azul Systems has reported seeing delays like this of 10s or more in production systems. The 10s example that he gave was from a Clojure program that involved a large memory copy.




Sunday, 24 February 2013

Are Java Assertions Enabled?

A quick tip if you ever need to test whether assertions are enabled in Java, without having to throw and catch an assertion exception.
    boolean ASSERTIONS_ENABLED = false;

    assert ASSERTIONS_ENABLED = true;
This code sets ASSERTIONS_ENABLED to false and then, if and only if assertions are enabled then the assert expression will run. The assert expression sets ASSERTIONS_ENABLED to true and returns true. Thus no exception will be thrown.

Thursday, 7 February 2013

Java 8 Early Access on OSX


Hurrah to Oracle and Apple. I had all but given up seeing the latest
production releases of Java appearing on OSX anytime soon. Today I
have been playing with the early access release of Java 8 on my mac. Fantastic
work, thank you!

Monday, 28 January 2013

Unit Testing: Mandatory or Optional?


I recently came across this nice post (http://agilewarrior.wordpress.com/2012/10/06/its-not-about-the-unit-tests/) and I wanted to share it with you, as it carries a very important message that separates the capable Software Engineers from the great Software Engineers.

In our industry, when we come across a practice that helps us to improve we tend to shout about it and over state its impact. In this post the author points out that Unit Testing is not commonly used in iPhone and iPad development; and yet their software is often highly regarded anyway. As an individual who was taught that high quality software had to be unit tested, this was earth shattering news for him; it literally led to many sleepless nights while he wrestled to incorporate this observation into his view of the world. Needless to say, unit testing is a very powerful tool and that it does belong in every professional software engineers tool box. But knowing when to use it, when not to use it and how to get the best gains from it is important. In fact, like any tool, misusing it can be just as bad as not using it at all. And most of all, unit testing is not a substitute for caring about the product that we are crafting.

Wednesday, 1 August 2012

Startups – no place for software engineers?

This post is inspired by http://vampwillow.wordpress.com/2012/07/05/startups-no-place-for-software-engineers/.

The post observes that startup businesses value getting something out, anything out fast is more important in the early days than maintainability. Which competes with the majority of our software engineering training and is thus a poor environment to practice and hone our skills.

Having worked in a few start ups, as well as range of other companies from small to corporation; I too have asked the same questions. However while I see wisdom in some of the conclusions, that post and other posts such as The Hustlers Manifesto sadden me.

As software engineers working for a business, we need to deliver solutions that help make the business a success (hopefully stating the obvious here, but stay with me). The skill in doing this is to deliver both what is asked for, and what is not. We are experts in technology and we are expected to also be experts in delivery of technology. That requires aligning that delivery, while keeping both costs and timescales down. That takes real skill. Learning to transition a project with a changing business is an important skill, that I would argue can only really be learnt by working in a range of environments; and that includes a startup style environment or three.

Sunday, 29 July 2012

A neat tool for detecting Memory Leaks from within a Unit Test (Java)


On the train back from work today I crafted an implementation of a HashWheel (a very cool algorithm for scheduling work), and while planning my unit tests I wanted to know that when a task had fired or been cancelled that the HashWheel released the job. Ala no memory leak. So I knocked up the following few lines that I thought were cool enough to share. The best bit was; it found a memory leak that I had missed straight away! Result! :)

I also added it to a github repository where you can find the full source code, take a look at TestTools.java under the public github repository threadtesting-mosaic.


The tool waits for up to three seconds (usually less than 40 milliseconds on my laptop; if it is going to pass that is) before throwing an exception.

To use the tool, just instantiate WeakReference and call TestTools.spinUntilReleased( ref ).

    public static void spinUntilReleased( final Reference ref ) {
        Runtime.getRuntime().gc();

        spinUntilTrue( new Predicate() {
            public boolean eval() {
                return ref.get() == null;
            }
        });
    }

Here is an example unit test that makes use of this tool:

    @Test
    public void scheduleTask_cancelViaTicketAndLetGoOfTask_expectTaskToBeGCd() {
        MyTask task1 = new MyTask();

        HashWheel.Ticket ticket = hashWheel.register( 120, task1 );
        ticket.cancel();

        final Reference ref = new WeakReference(task1 );
        task1 = null;

        TestTools.spinUntilReleased( ref );
    }

For completeness, here is the implementation of spinUntilTrue. Which can also be found in the threadtesting-mosaic repository.
    public static void spinUntilTrue( Predicate predicate ) {
        spinUntilTrue( 3000, predicate );
    }

    public static void spinUntilTrue( long timeoutMillis, Predicate predicate ) {
        long startMillis = System.currentTimeMillis();

        while ( !predicate.eval() ) {
            long durationMillis = System.currentTimeMillis() - startMillis;

            if ( durationMillis > timeoutMillis ) {
                throw new IllegalStateException( "Timeout" );
            }

            Thread.yield();
        }
    }

Sunday, 22 July 2012

GitHub Work Culture (people change jobs because of burn out, how to prevent burn out while still working hard?)

A colleague pointed me at this little meme: http://vimeo.com/43676958

Most company work spaces would destroy what they have to say as dangerous, claiming that it would never work.  The interesting thing is that it does work for GitHub, and it works very well.

For me it reminds me of something a very good manager once taught me; the role of a manager is to create and protect the environment and culture for productive software development. It only takes one manager to ignore that advise to damage or destroy the soul of a work place and GitHub has pushed back hard against that decay in thought provoking ways.

Tuesday, 29 May 2012

Zeebox nominated for T3 Best App of the Year award


If you have been enjoying zeebox this year, then please vote for us in the T3 awards. To do so, just click  here.

Java Modulo vs Bitmask benchmarks

We all like things to run fast. A well known optimisation for ring buffers, consistent hashes and hash tables alike is to replace the modulo operator with a bitmask. The trick being to keep the length of the arrays to being a power of two. Thus replacing a costly operation with a much cheaper one. The question that I wanted to answer here is not whether this optimisation works, but on the Java stack how much of a difference does it make. The following timings were taken running JDK 1.6.0_31 on a 2GHz hyper threaded quad core MacBook, which repeated each operation from cold ten million times each. The table shows that so long as the array length is a multiple of two then hotspot will eventually replace % with & making this optimisation only worth applying to speed up the pre-optimisation window. It also shows that the speed up is roughly a factor of three.

Min (ms)Max (ms)Per Iteration
v % 5174.812273.811.5ns
v % 468.684127.5080.6ns before hotspot, 0.4ns after
v & 364.4589.1340.4ns


Conclusion: When using % n, aim to have n to a power of two. This gave a threefold performance improvement within this benchmark.  The interesting result here is that Hotspot is capable of optimising the modulo operator, rewriting it to a bitmask for us on the fly so long as the division is to the power of two.

Appendium (May 2013): Over the last year I have learnt more about how Intel CPUs are structured, and a few interesting facts have emerged. Firstly a divide instruction takes approximately 80 CPU cycles to execute (ouch!) and can be pipelined at the throughput rate of 20-30 cycles. This is compared to a logical AND which takes 1 cycle to execute, and has a throughput of 0.5.  It also turns out that only one of the CPU ports is capable of performing division but multiple are capable of bitmasks.  Thus using a bitmask is not only much faster than division but more of them may be run in parallel too.   CPU time taken from x86 Optimisation guide (checkout table C-16 in the appendices).  This level of parallelism was not seen in this microbenchmark because the instructions were all modifying the same data.  Also note that this benchmark focused on measuring throughput interlaced with additions and for loop iteration rather than instruction latency; thus hiding some of the cost of performing a division.

View the benchmark code

Tuesday, 20 March 2012

Using Spin Locks to simplify unit testing of async code

A common barrier to working with concurrent code is having confidence in it. It can be difficult to unit test. The most common solution is to generate events that the unit test can hook in to. However that adds complexity and sometimes it is either too difficult, muddy or just not desirable. In those cases a simpler tool is the good old spin lock. Below is a Scala wrapper around the JUnit assertEquals method that keeps retrying a condition until it is true. If that condition is not true within n milliseconds then the test fails. Simple, but effective.
  def assertEqualsWithRetry[T]( expected:T, actual: => T, maxDurationMillis:Int=5000 ) {
    val startMillis    = System.currentTimeMillis()
    def durationMillis = System.currentTimeMillis() - startMillis

    while ( durationMillis < maxDurationMillis && expected != actual ) {
      Thread.`yield`()
    }

    assertEquals( expected, actual )
  }

Thursday, 29 December 2011

Zeebox, ranked number 6 media application above Facebook

The top ten media apps of 2011

Not a bad result for a product that took 3 months of development before its first release on the iPad and has not even been released outside of the UK yet. 2012 is going to be a big year for us!